Step 1:
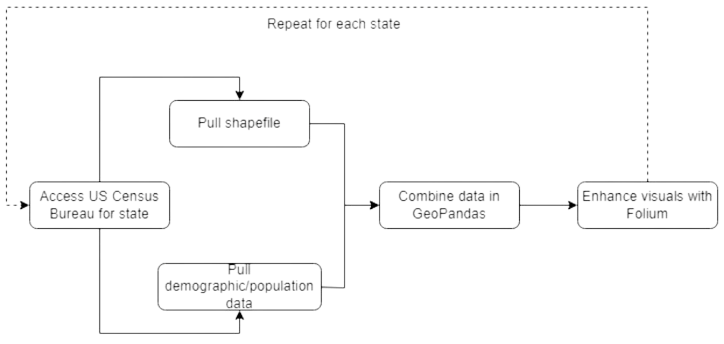
Access US Census Bureau for State
The first step is to access the US Census Bureau for the state you are interested in. This will allow you to pull the shapefile and demographic/population data for the state.
Step 3:
Enhance Visuals with Folium
The third step is to enhance the visuals with Folium. This will allow you to create an interactive map that will be displayed on the web.
Our Implementation Overview

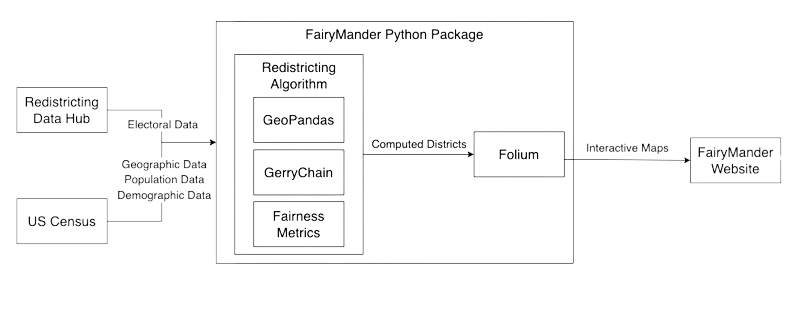
⇒ We aim to fulfill these requirements using a Pipe-Filter model for creating and displaying district maps. Firstly, the data component of our project will consist of electoral data from Redistricting Data Hub, a well respected resource for districting data, as well as geographic, population, and demographic data pulled from the US Census. Then, this data can then be fed into our developed Python package, which is the heart of our project. Through this package, we will perform a redistricting algorithm using the geographical data tool pandas, assisted by GerryChain, a package developed by the Metric Geometry & Gerrymandering Redistricting Lab at Tufts University. These generated districts will be evaluated using fairness metrics pulled from the literature on evaluating district fairness. These maps will then be visualized using Folium, which converts geopandas data into an interactable map. Finally, these interactable maps will be made available on our website, along with justification for the generated district plan and further education on redistricting practices.


